
:::


Statistical Report
Last Update: Sep 21, 2026
Ionizing Radiation Application and Management Statistics
2019
2020
2021
2022
2023
2024
2025
National Occupational Dose Management
Occupation Radiation Exposure in Taiwan, Republic of China, 2025
According to Paragraph 1 of Article 15 of Ionizing Radiation Protection Act (IRPA) : To ensure that radiation workers’ occupational exposure is below limits and kept as low as reasonably achievable, the employer shall monitor each radiation worker's dose. The Nuclear Safety Commission conducts statistical analysis of data of radiation workers every year to understand the number of radiation workers growth trend and dose distribution in Taiwan.
The annual report of NDCORE contains each working category in 2025, collects and analyzes occupational external radiation exposure data read from Thermolucent Dosimeters worn by radiation workers from 2000 to 2025 (with dosage value from neutron badges already included). Statistical results include: number of monitored persons and average dose in each dose interval, collective dose in each dose interval, number of persons in each age interval and sex group, and average monthly dose.
There were 59,956 radiation workers in Taiwan in 2025. Since 2000, the average annual growth rate has been 3.02%. There were 1,541 persons increase, increase rate of 2.64 % from 2024 to 2025, i.e., an increase mainly from medical, industrial, and others categories workers as shown in Figure 1. Historically, the male-to-female ratio was approximately 65.7% to 34.3%, compared with 61.1% to 38.9% in 2025.
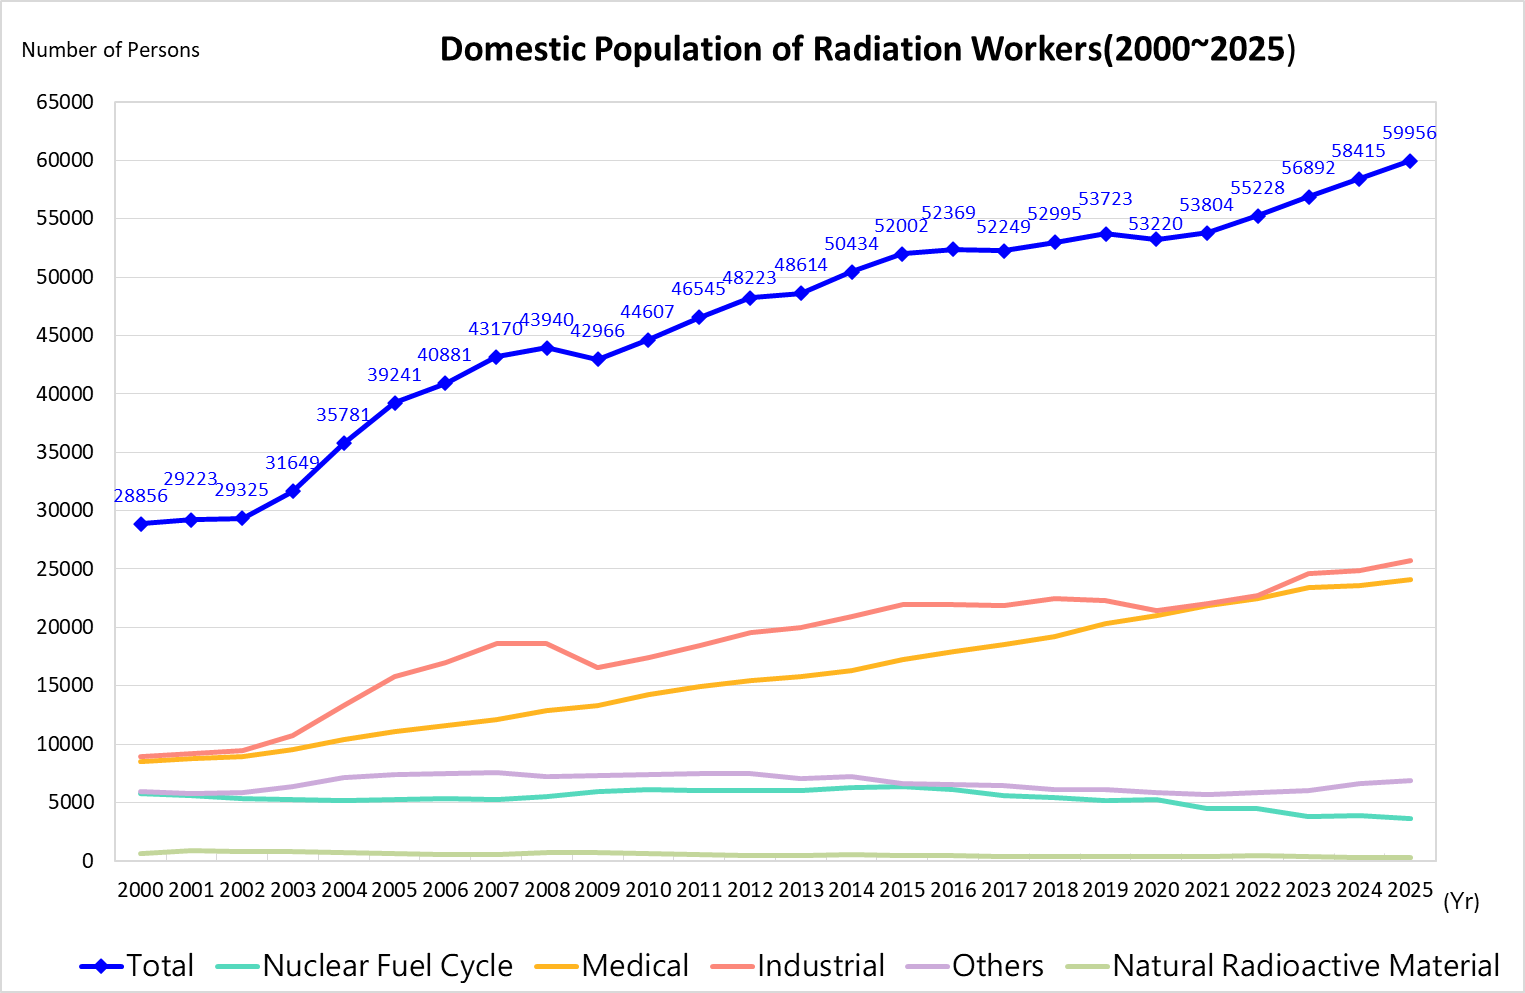
Figure 1 Population of Radiation Workers
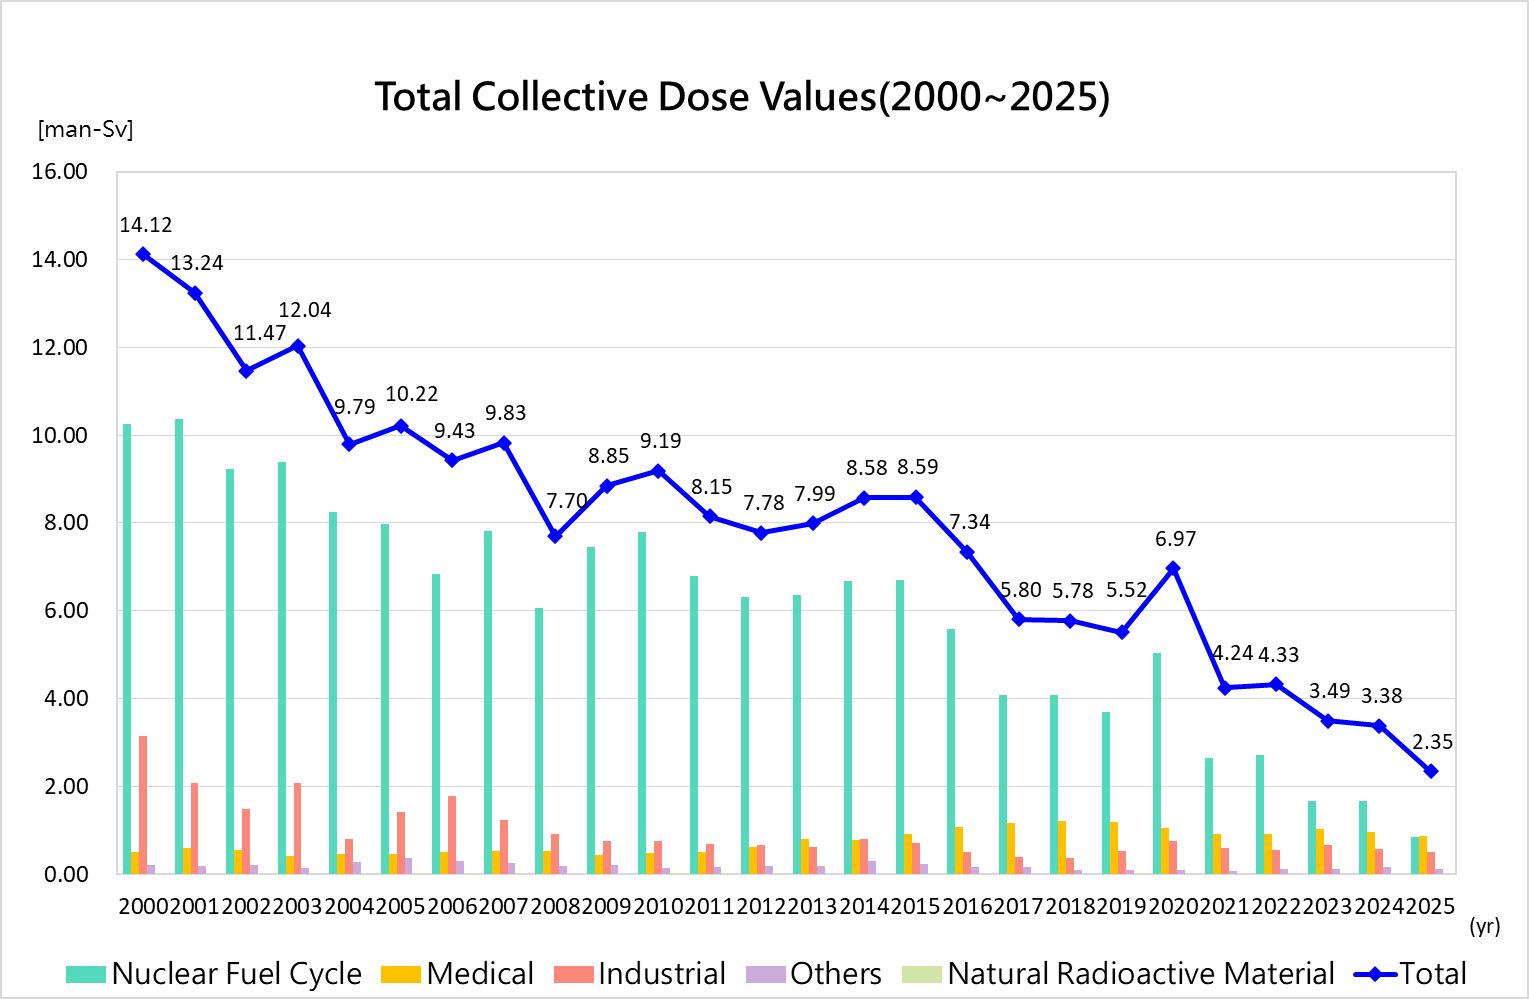
Figure 2 Total Collective Dose Values
Collective dose in 2025 is 2.35 man-sieverts. Domestic average annual collective dose is approximately 7.93 man-sieverts. Major dose are from nuclear fuel cycle, medical and industrial categories. Their annual collective dose occupied 36.11 %, 36.80 % and 21.60 % respectively, as shown in Figure 2. In 2025, a total of 2,549 radiation workers recorded measurable doses, with an average dose of 0.92 mSv, The average dose across all radiation workers was 0.04 mSv. Average annual dose of workers with measurable dose is 1.50 mSv from 2000 to 2025. Average annual dose for total monitored persons is 0.19 mSv from 2000 to 2025, which has a downward trend, as shown in Figure 3.
Based on historical statistics, following the regulation “Safety Standards for Protection against Ionizing Radiation”(amended in 2003), the effective dose exposed by a radiation worker shall not exceed 100 mSv within a cycle of 5 years, nor 50 mSv within each year. Accordingly, since 2003, no radiation worker has received an annual dose exceeding 50 mSv. The number of radiation workers receiving doses exceeding 20 mSv began to decline from 101 in 2000, and has remained at zero from 2021 to the present, as shown in in Figure 4.
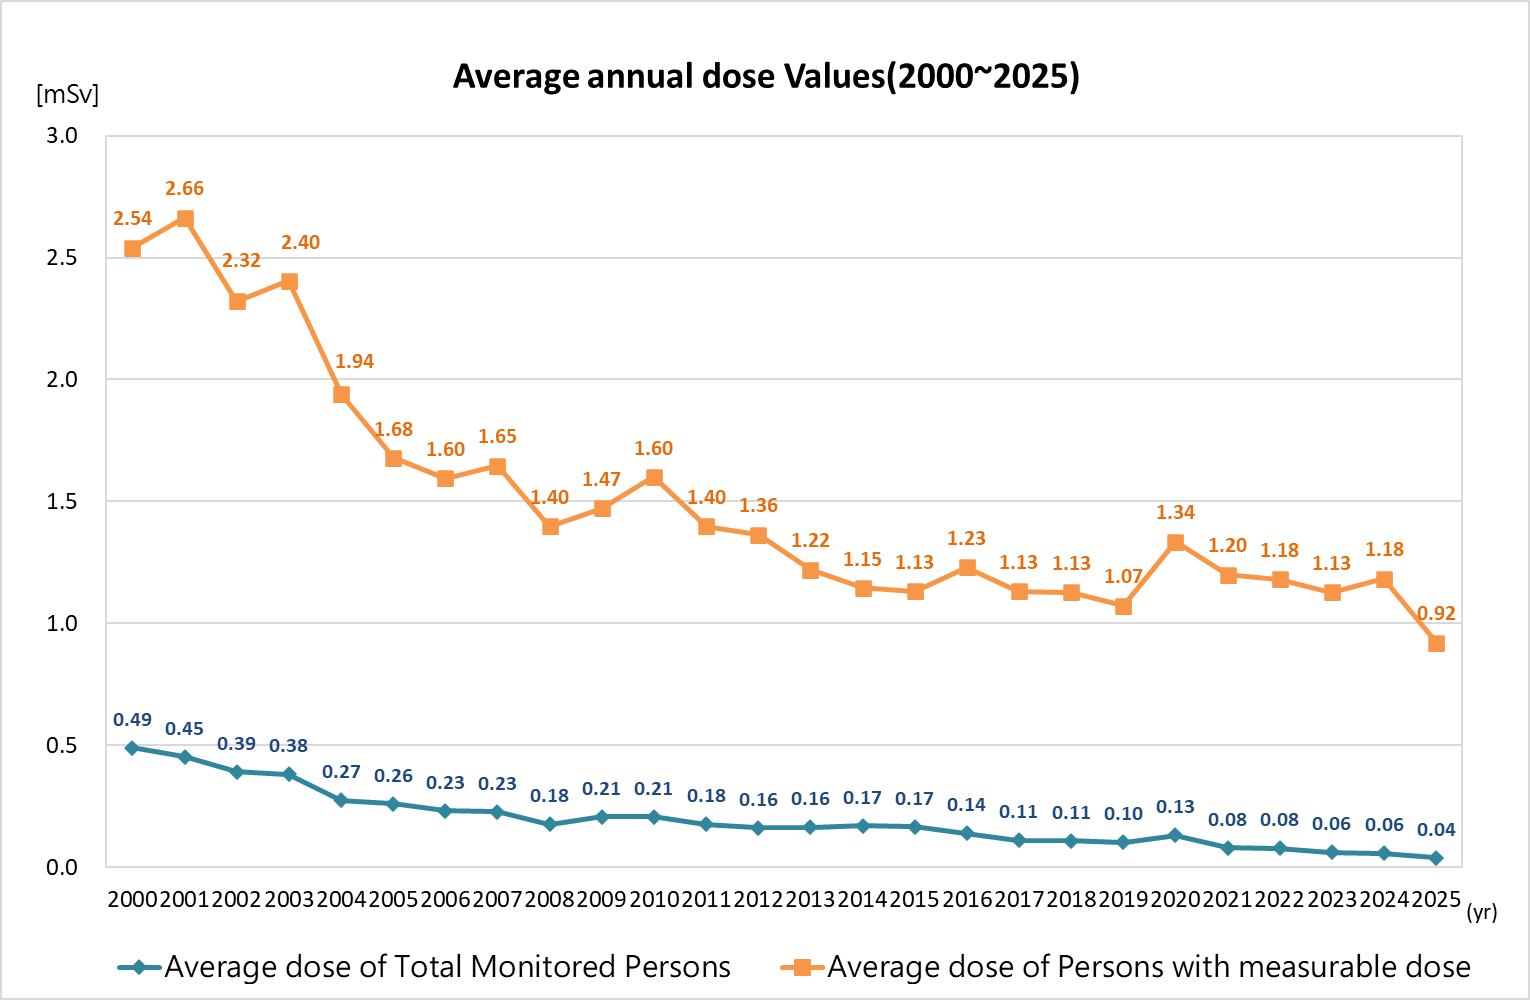
Figure 3 Average Annual Dose Values
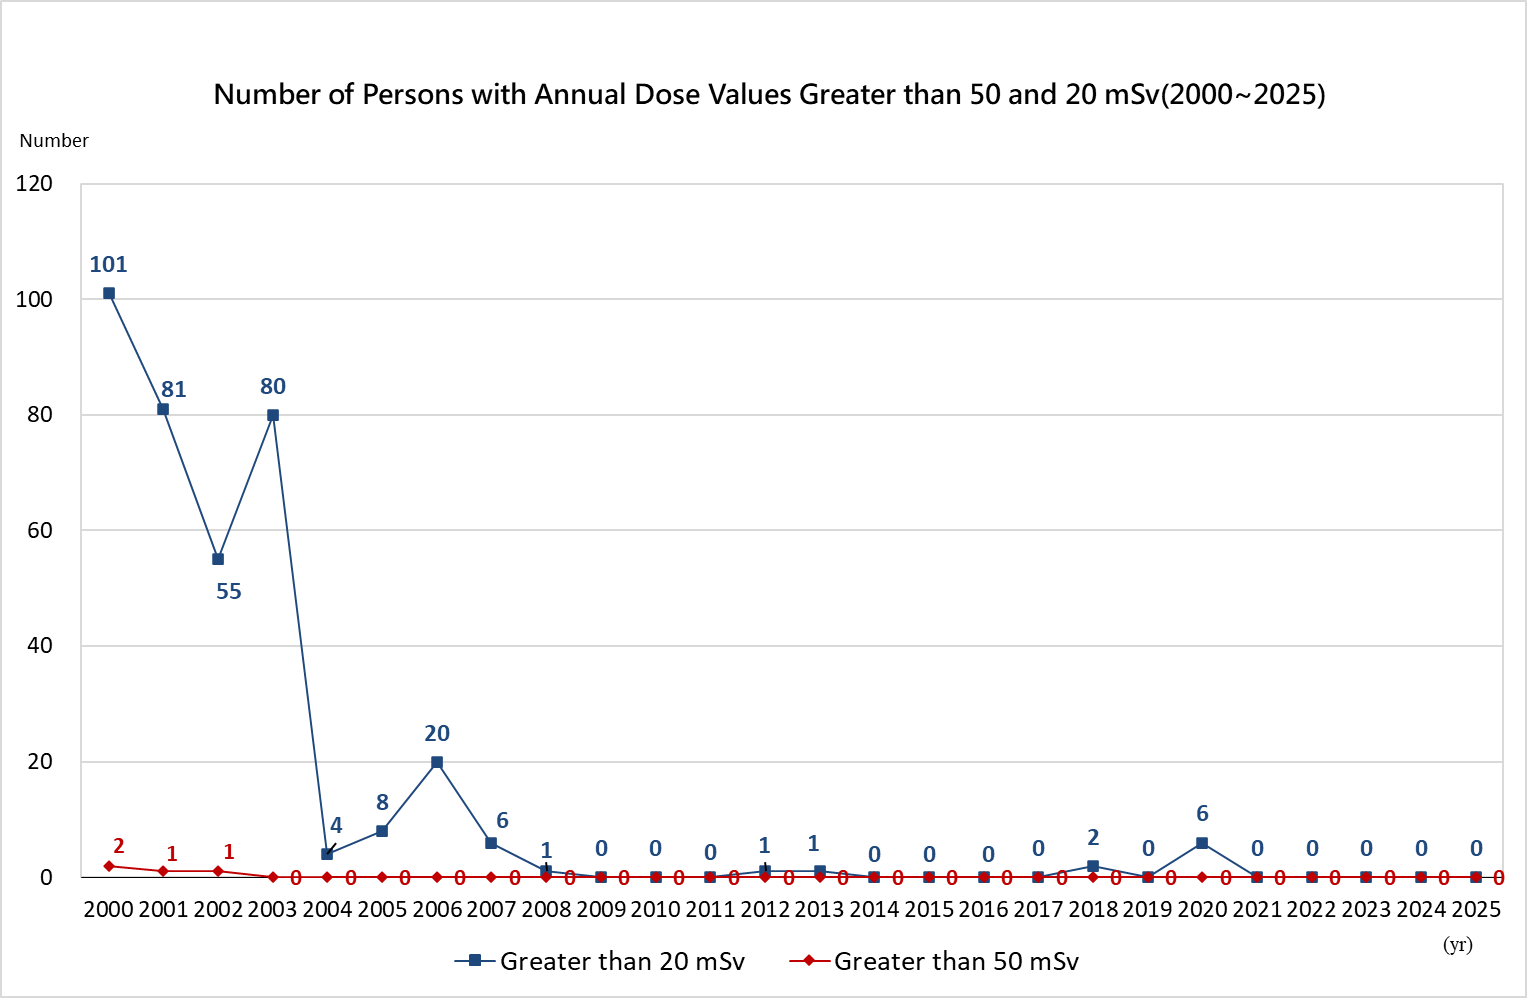
Figure 4 Number of Persons with Annual Dose Values Greater than 50 and 20 mSv

2019
2020
2021
2022
2023
2024
2025
National Occupational Dose Management
Occupation Radiation Exposure in Taiwan, Republic of China, 2025
According to Paragraph 1 of Article 15 of Ionizing Radiation Protection Act (IRPA) : To ensure that radiation workers’ occupational exposure is below limits and kept as low as reasonably achievable, the employer shall monitor each radiation worker's dose. The Nuclear Safety Commission conducts statistical analysis of data of radiation workers every year to understand the number of radiation workers growth trend and dose distribution in Taiwan.
The annual report of NDCORE contains each working category in 2025, collects and analyzes occupational external radiation exposure data read from Thermolucent Dosimeters worn by radiation workers from 2000 to 2025 (with dosage value from neutron badges already included). Statistical results include: number of monitored persons and average dose in each dose interval, collective dose in each dose interval, number of persons in each age interval and sex group, and average monthly dose.
There were 59,956 radiation workers in Taiwan in 2025. Since 2000, the average annual growth rate has been 3.02%. There were 1,541 persons increase, increase rate of 2.64 % from 2024 to 2025, i.e., an increase mainly from medical, industrial, and others categories workers as shown in Figure 1. Historically, the male-to-female ratio was approximately 65.7% to 34.3%, compared with 61.1% to 38.9% in 2025.
Figure 1 Population of Radiation Workers
Figure 2 Total Collective Dose Values
Collective dose in 2025 is 2.35 man-sieverts. Domestic average annual collective dose is approximately 7.93 man-sieverts. Major dose are from nuclear fuel cycle, medical and industrial categories. Their annual collective dose occupied 36.11 %, 36.80 % and 21.60 % respectively, as shown in Figure 2. In 2025, a total of 2,549 radiation workers recorded measurable doses, with an average dose of 0.92 mSv, The average dose across all radiation workers was 0.04 mSv. Average annual dose of workers with measurable dose is 1.50 mSv from 2000 to 2025. Average annual dose for total monitored persons is 0.19 mSv from 2000 to 2025, which has a downward trend, as shown in Figure 3.
Based on historical statistics, following the regulation “Safety Standards for Protection against Ionizing Radiation”(amended in 2003), the effective dose exposed by a radiation worker shall not exceed 100 mSv within a cycle of 5 years, nor 50 mSv within each year. Accordingly, since 2003, no radiation worker has received an annual dose exceeding 50 mSv. The number of radiation workers receiving doses exceeding 20 mSv began to decline from 101 in 2000, and has remained at zero from 2021 to the present, as shown in in Figure 4.
Figure 3 Average Annual Dose Values
Figure 4 Number of Persons with Annual Dose Values Greater than 50 and 20 mSv

